Dashboard Page Overview
Last updated: June 8, 2026

The Dashboard Page (located in Performance > Dashboard) is an overview of your entire sales pipeline, including revenue and volume forecasts for active deals.
This page includes four sections:
Deals Dashboard
Rolling Sales Forecast
Sales Pipeline graph
Companies in Pipeline table
Deals Dashboard
The Deals Dashboard summarizes your active deal metrics, which are useful for higher level CRM management and forecasting.
Quick Definitions:
Unweighted = Does not factor in your close date or win rate when calculating values.
Forecasted = Weighted, takes both close date and win rate into account for calculations.
Rolling Sales Forecast
The Rolling Sales Forecast allows you to gauge expected revenue or sales volume over varying time frames (12-36 months) using weighted data.
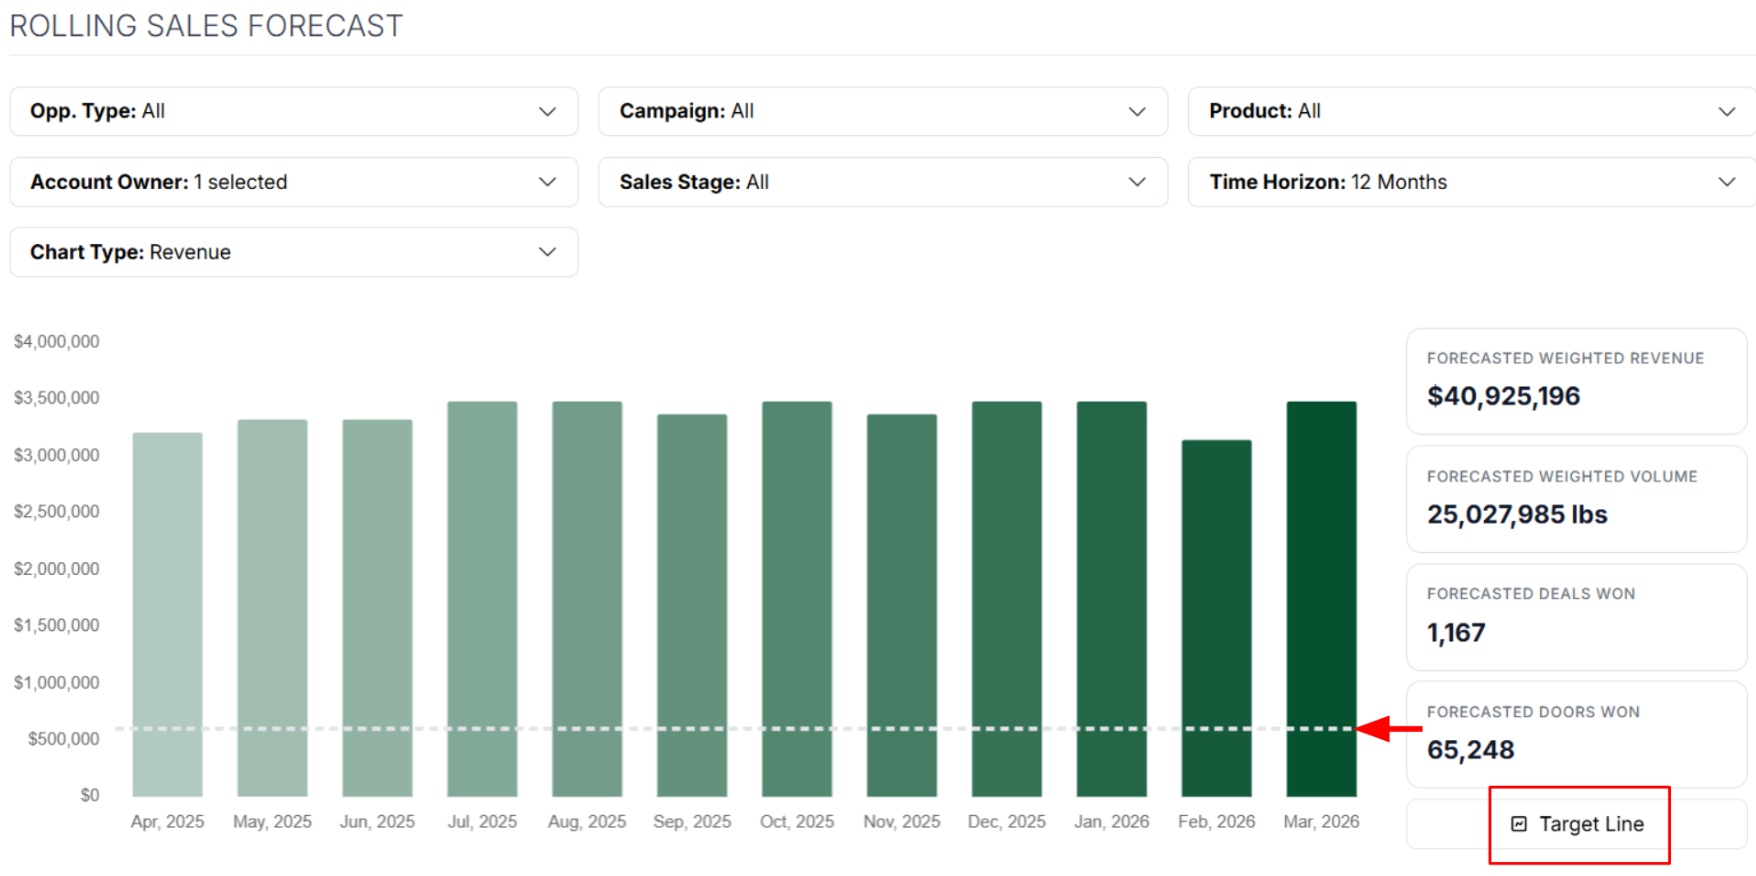
Customize the Target Line (dotted line) to match your goals
Forecast predicted revenue for yourself or a teammate
Use filters to focus on a specific campaign, product, or opportunity type’s projected value
Sales Pipeline
The Sales Pipeline graph visualizes your funnel by sales stage, providing projected deal values at each stage. You can view revenue forecasts based on time-specific projections or account size, using either weighted or unweighted values.

Identify bottlenecks: Where are deals stalling?
Track weighted revenue to estimate how much is likely to close
Analyze trends in deal flow and conversion rates over time to optimize your sales strategy
Companies in Pipeline
While the Deals page displays individual deals, this table aggregates all companies with active or closed deals in your pipeline, providing a comprehensive view of deal activity by company. Selecting a company name directs you to its dedicated Company page for detailed insights.

Gauge Revenue Opportunity within your pipeline
Evaluate or prioritize pipeline leads based on your last interaction (Last Update) or Annual Revenue Opportunity.
Filter by stage to focus on bottlenecks within the pipeline
Search for a specific business to see the value of all combined deals